
Buried features became 2 clicks away, and one fix saved over $1M a year.
A customer once asked for a feature we'd shipped months earlier. It was 14 tabs away. From 2017 to 2019 I went to see how security analysts really work, then helped take Symantec's enterprise products dark, flat and consistent, leading UX for 10+ of them. Here's how I did it, and the decisions that made it work.
Any major screen in 2 clicks, and $1M+ a year saved in support.
A feature that had been live for months sat behind 14 horizontal tabs. After a full inventory and a flat navigation, any major screen was 2 clicks away. A fix I found in user testing saved over $1M a year in support costs. Along the way the products went dark, for analysts working in dim rooms, and moved toward one design system.
Most of the work at a security company stays private, including who uses it. These are the numbers I can share.
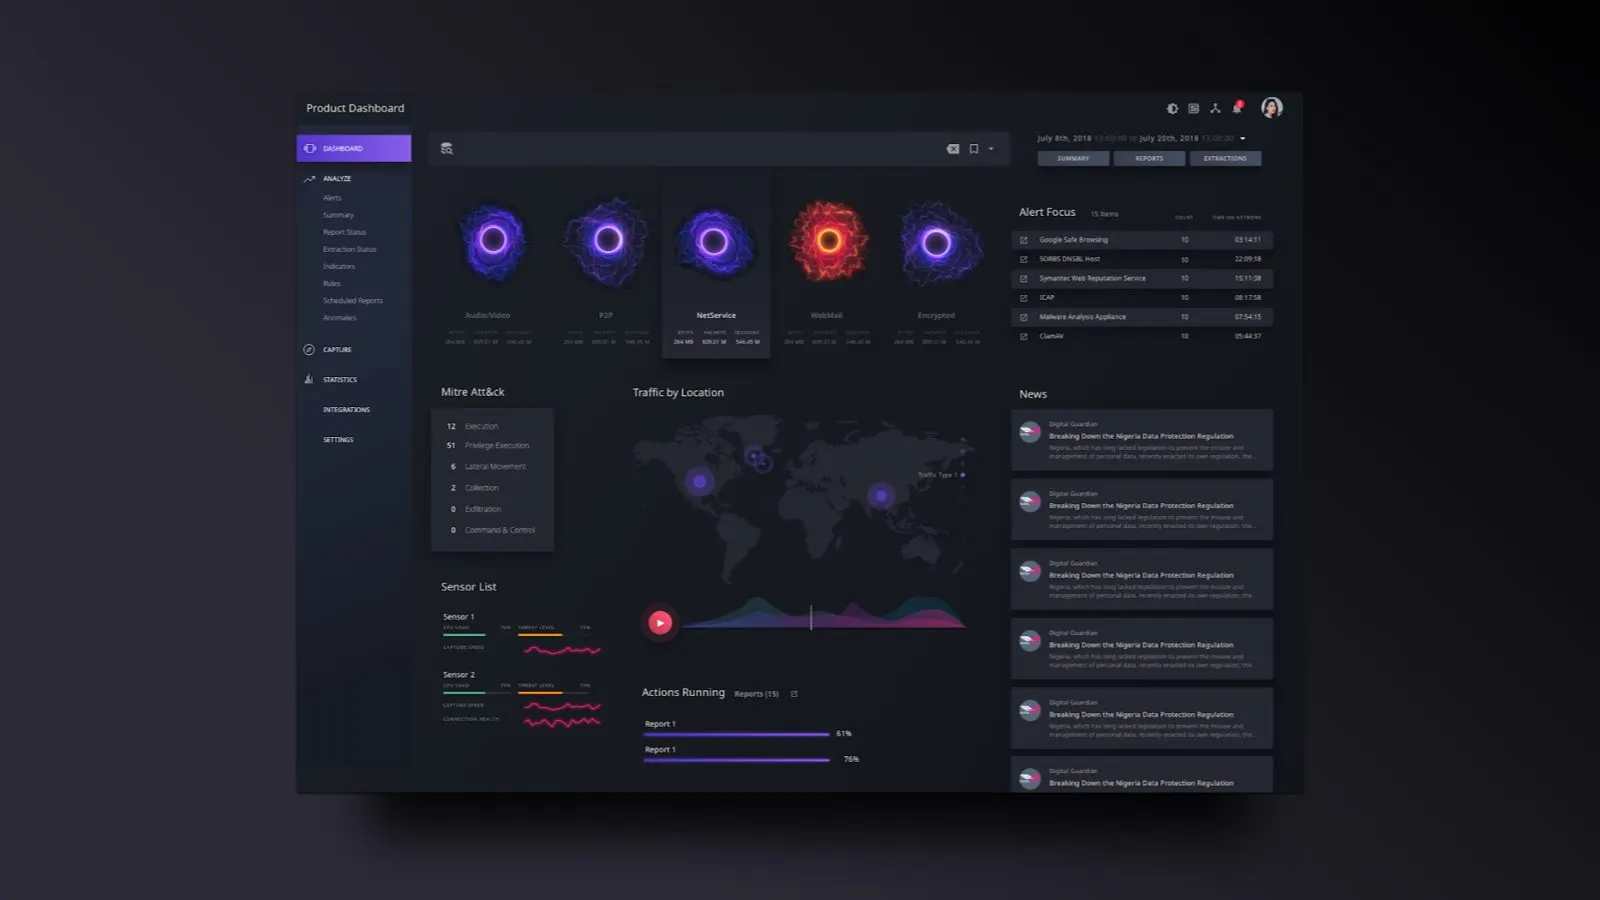
Where it ended up: a dark Security Analytics dashboard, with Halo rings, a world traffic map and a news feed.
Powerful products that looked like the late 90s.
When I arrived, Symantec had some extremely powerful products with features buried deep inside them. Security Analytics could dig through petabytes of network traffic. The people using it were sophisticated analysts protecting real assets from real threats.
Our list of problems was short and hard. Data people couldn't act on. Buried features. Slow workflows. Charts that couldn't carry enough dimensions. A look that felt outdated next to the competition.
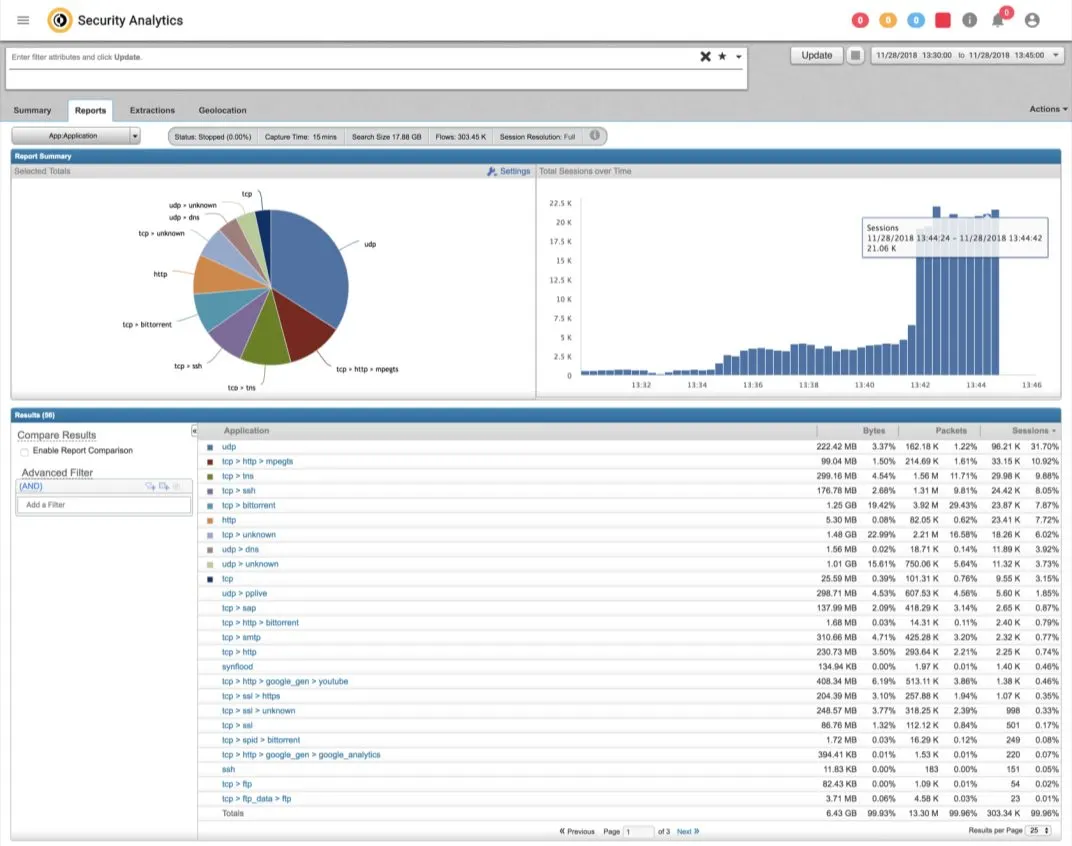
Security Analytics, where we started: bright white, small type, and a long table.
So I went to where the software actually lives.
I visited many customers and government agencies and sat with the people running their security. Most of what I saw is private, so there are no names and no site photos on this page. I can tell you what changed how I design.
We paired the visits with a large survey of Security Analytics users. Here's some of what we learned.
Paraphrased from research, with names and organizations removed.
Customers couldn't find our features, so we made every major screen 2 clicks away.
A large customer gave us a hard time for not delivering a major feature we'd promised six months earlier. The product manager said it had been live for over four months, and scrolled through 14 horizontal tabs to find it.
Silence. Then the customer said it was great, and thanks.
We were building great features, and our customers couldn't find them.
So we did a huge inventory and built a responsive, expandable navigation that kept everything flat. No horizontal tabs. No features nested layer after layer. 2 clicks maximum to reach any major screen.
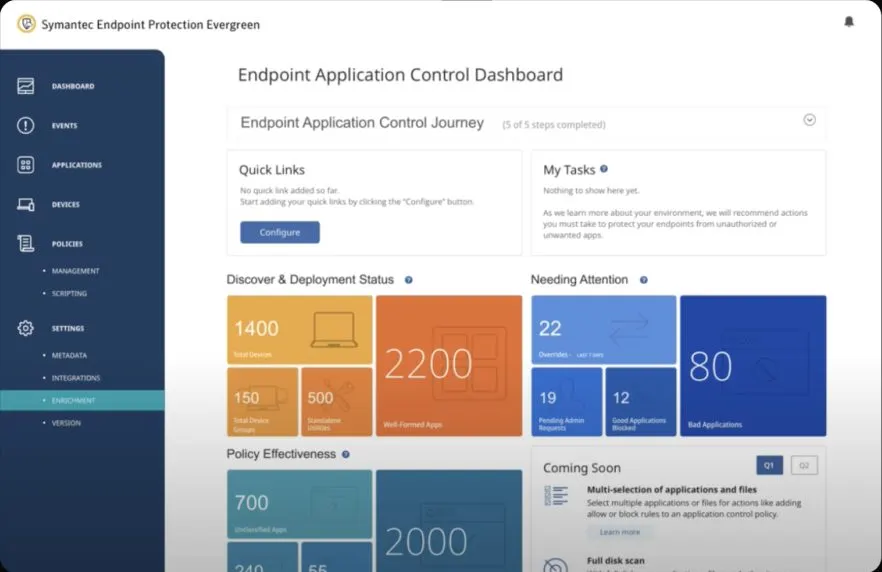
The flat navigation on an Endpoint Protection dashboard.
The room was dark and our screen hurt to look at, so we went dark.
A security operations center runs with the lights off and walls of monitors. Every screen in the room was dark except ours. It literally hurt to look at. That's physical pain caused by software. So we went dark.
We didn't spring it on people. First came a reskin: same layout, same features, a new look. We mapped 39 screens, down to every modal and menu. That gave analysts time to get used to the look before we changed how anything worked. Then we redesigned the dashboard itself.
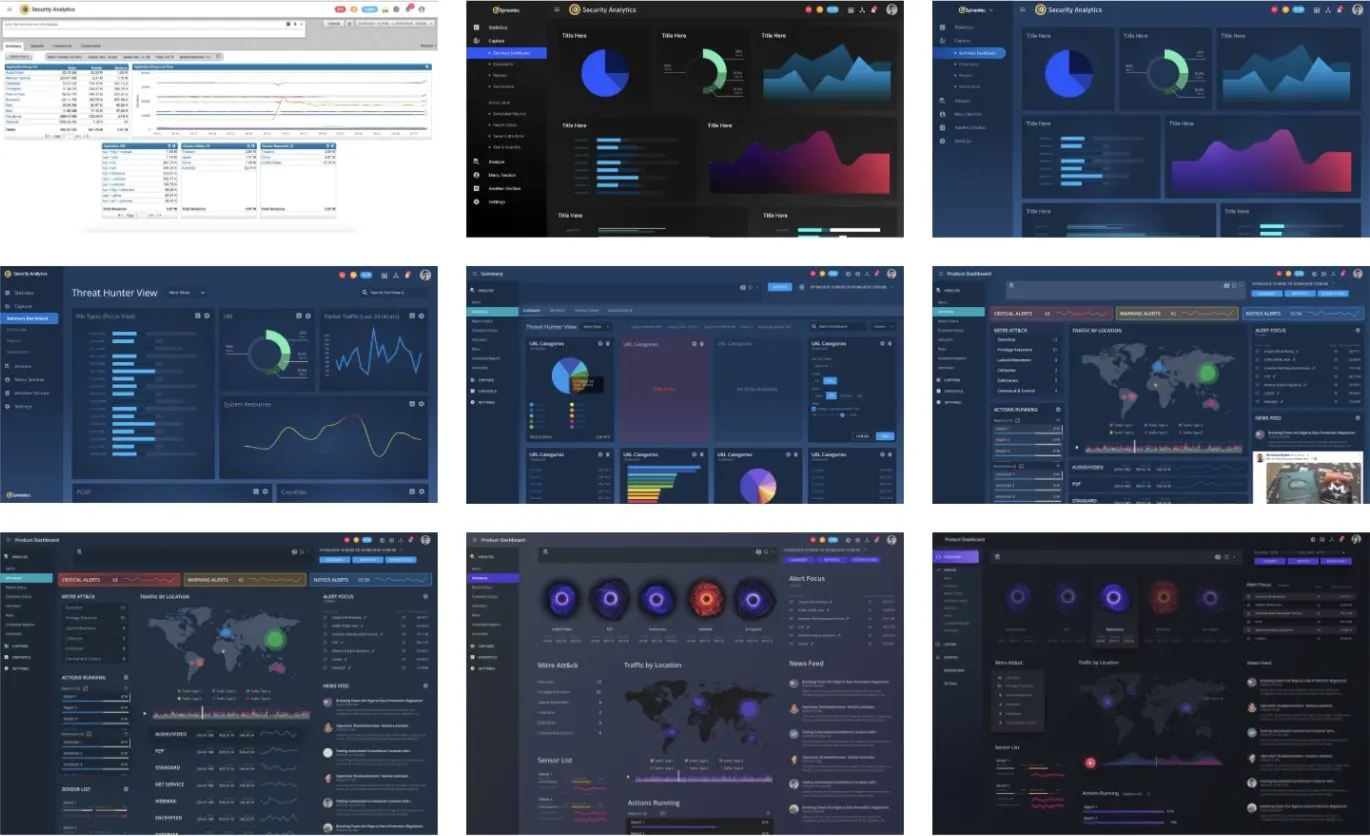
The old light screen at top left, then round after round of dark dashboards.
- Dark theme
- Shipped after site visits showed the old interface caused eye strain in dim rooms.
- Alerts
- A new alerts screen where analysts could edit rules on the fly, right where they saw the noise.
- Report summary
- Reports over petabytes take real time to run. The new summary made results clear and useful the first time.
- Executive reports
- A customizable security summary for company leaders who never open the tool.
- Certificate management
- User testing turned up a UX problem that was costing support money. The fix saved over $1M a year.
One animated ring carries six dimensions, so analysts read traffic like body language.
Our users wanted more than a 2D chart can hold, so we used an animated visualization called Halo. One ring carries six dimensions at once: speed, size, color, complexity, brightness and wobble. Each one could be assigned to any metric.
Healthy traffic looks like a calm purple ring. When something's wrong, the ring looks anxious and irritated. You read it the way you read a person across a table, and you know where to look next.
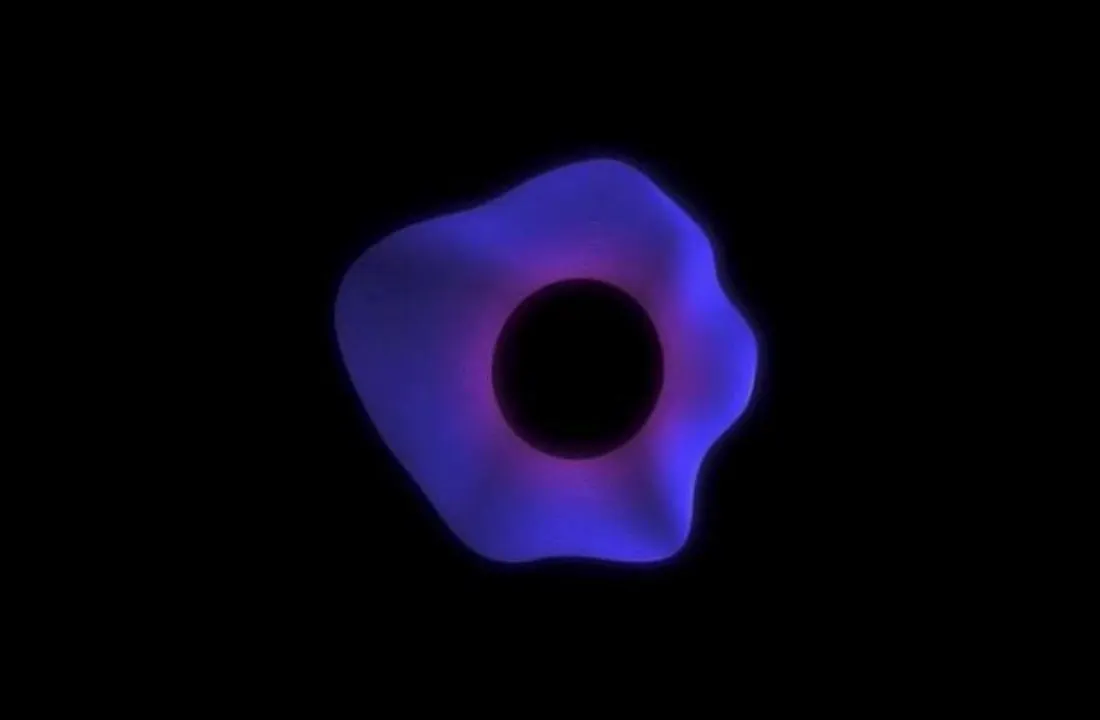
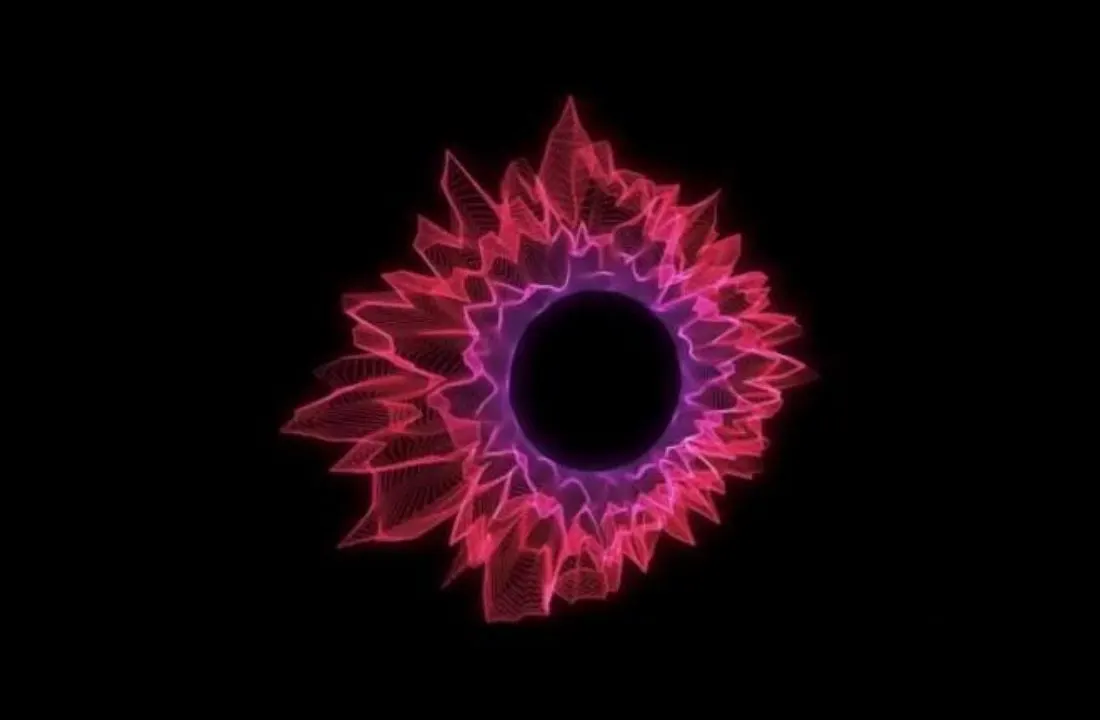
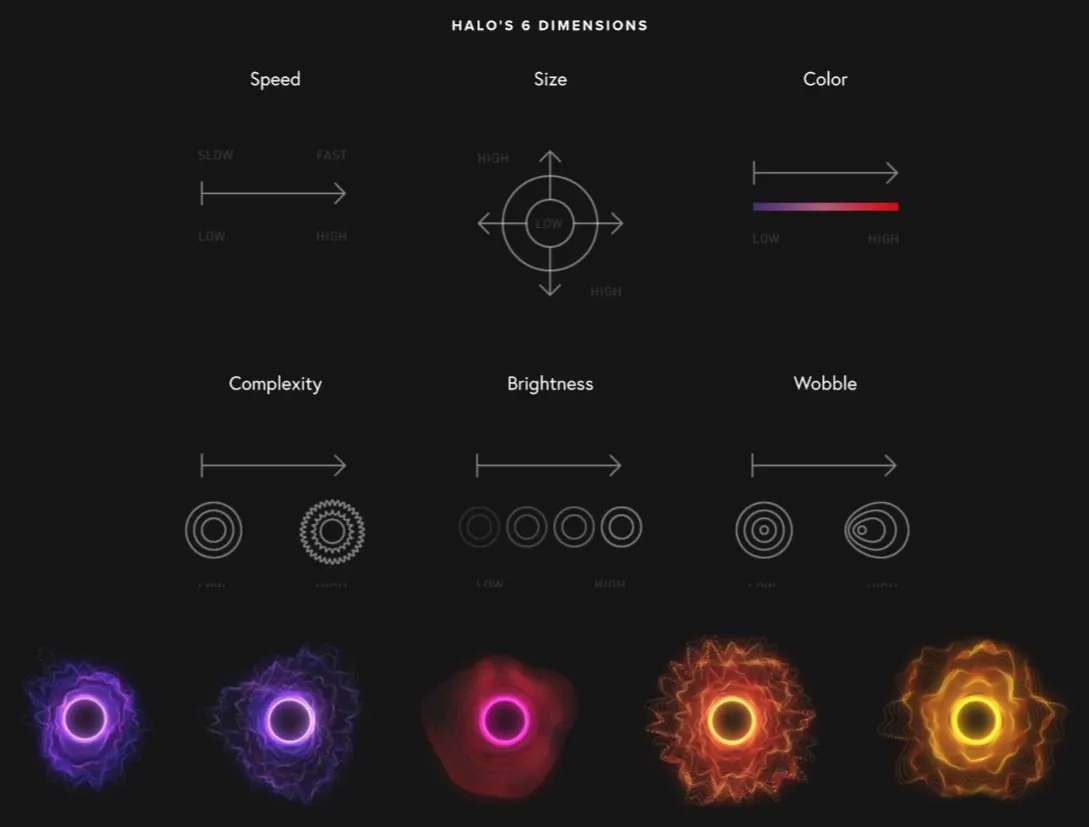
The six dimensions, and the moods they make.
A whiteboard makes it cheap to be wrong.
A whiteboard makes it cheap to be wrong. I like to get an idea up early, blow it up, and draw it again. One wall started as a list: MITRE ATT&CK, alerts, kill chain, sensors, live feeds, world map. Each item grew a sketch and a pile of orange questions. How many rules do users have? Can we say for sure? What can we show here?
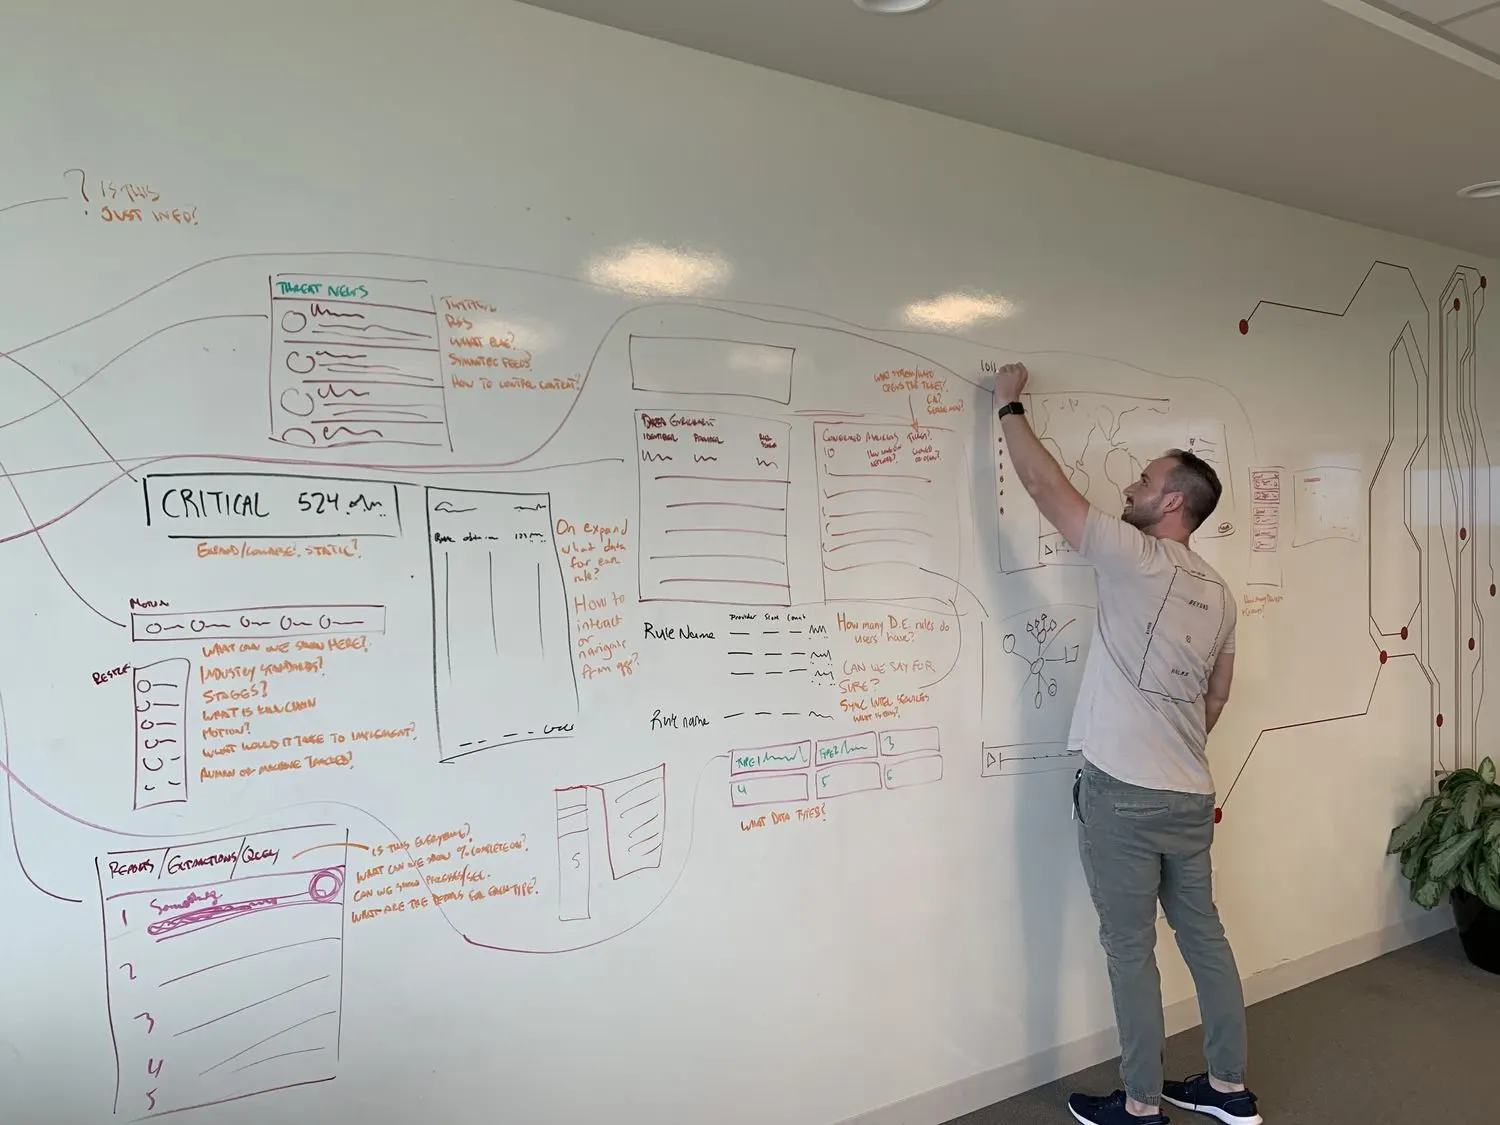
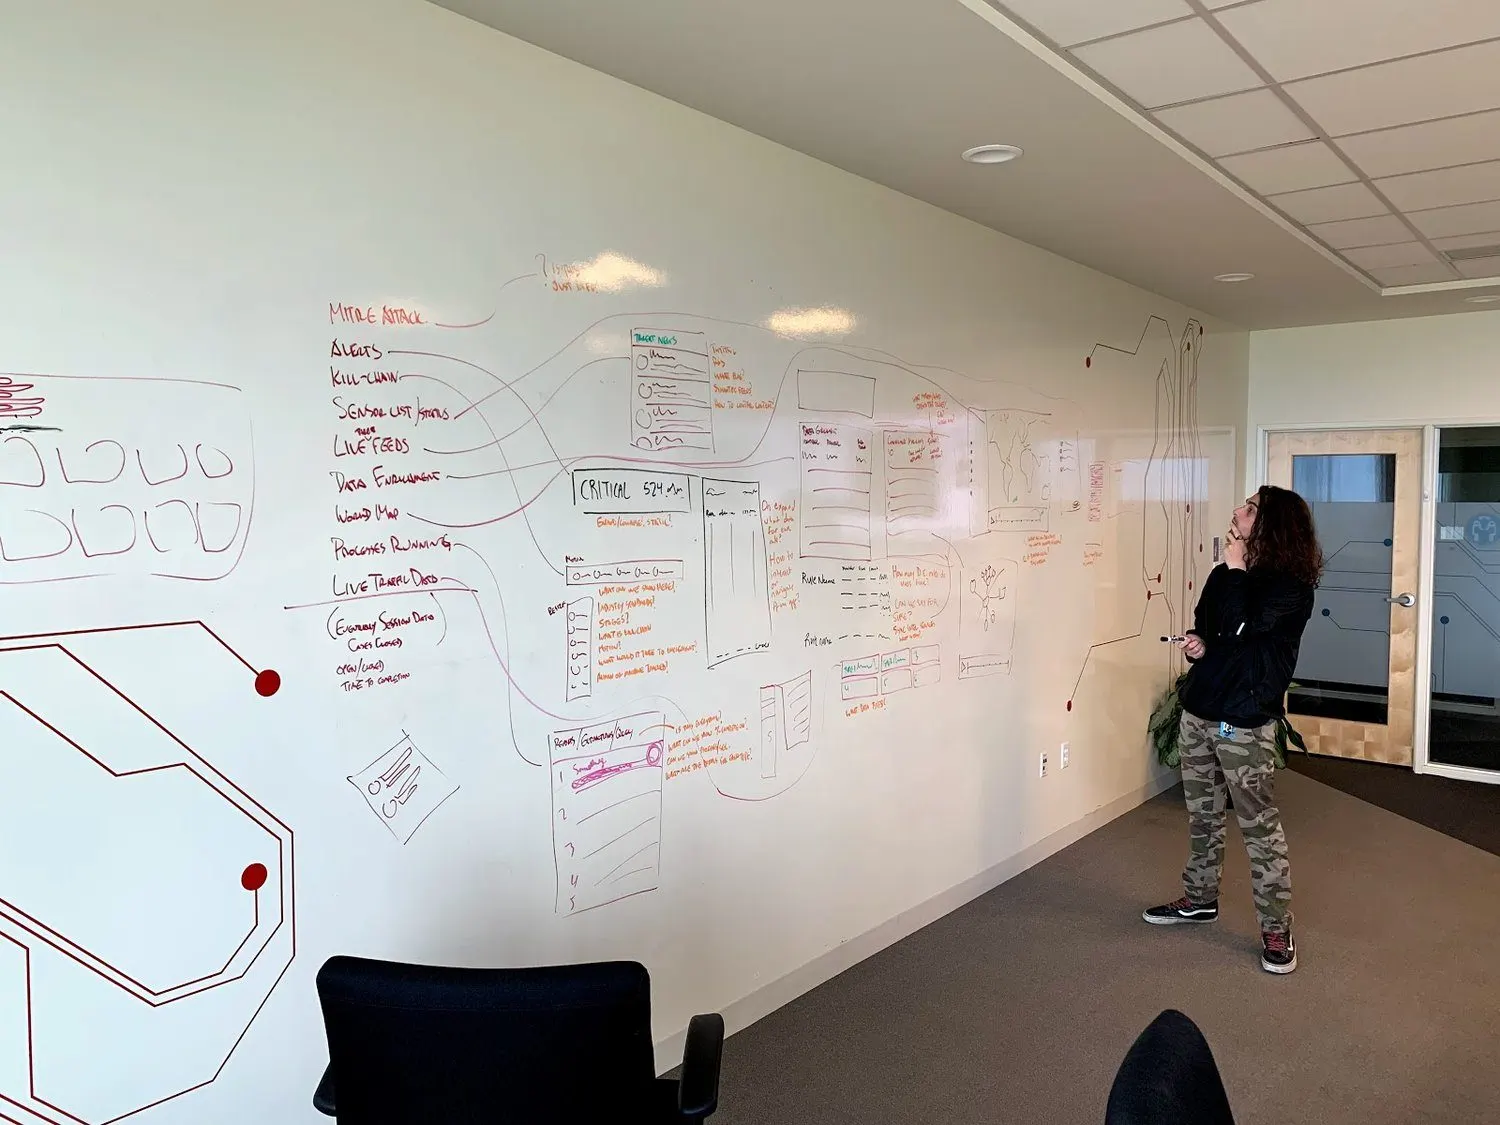
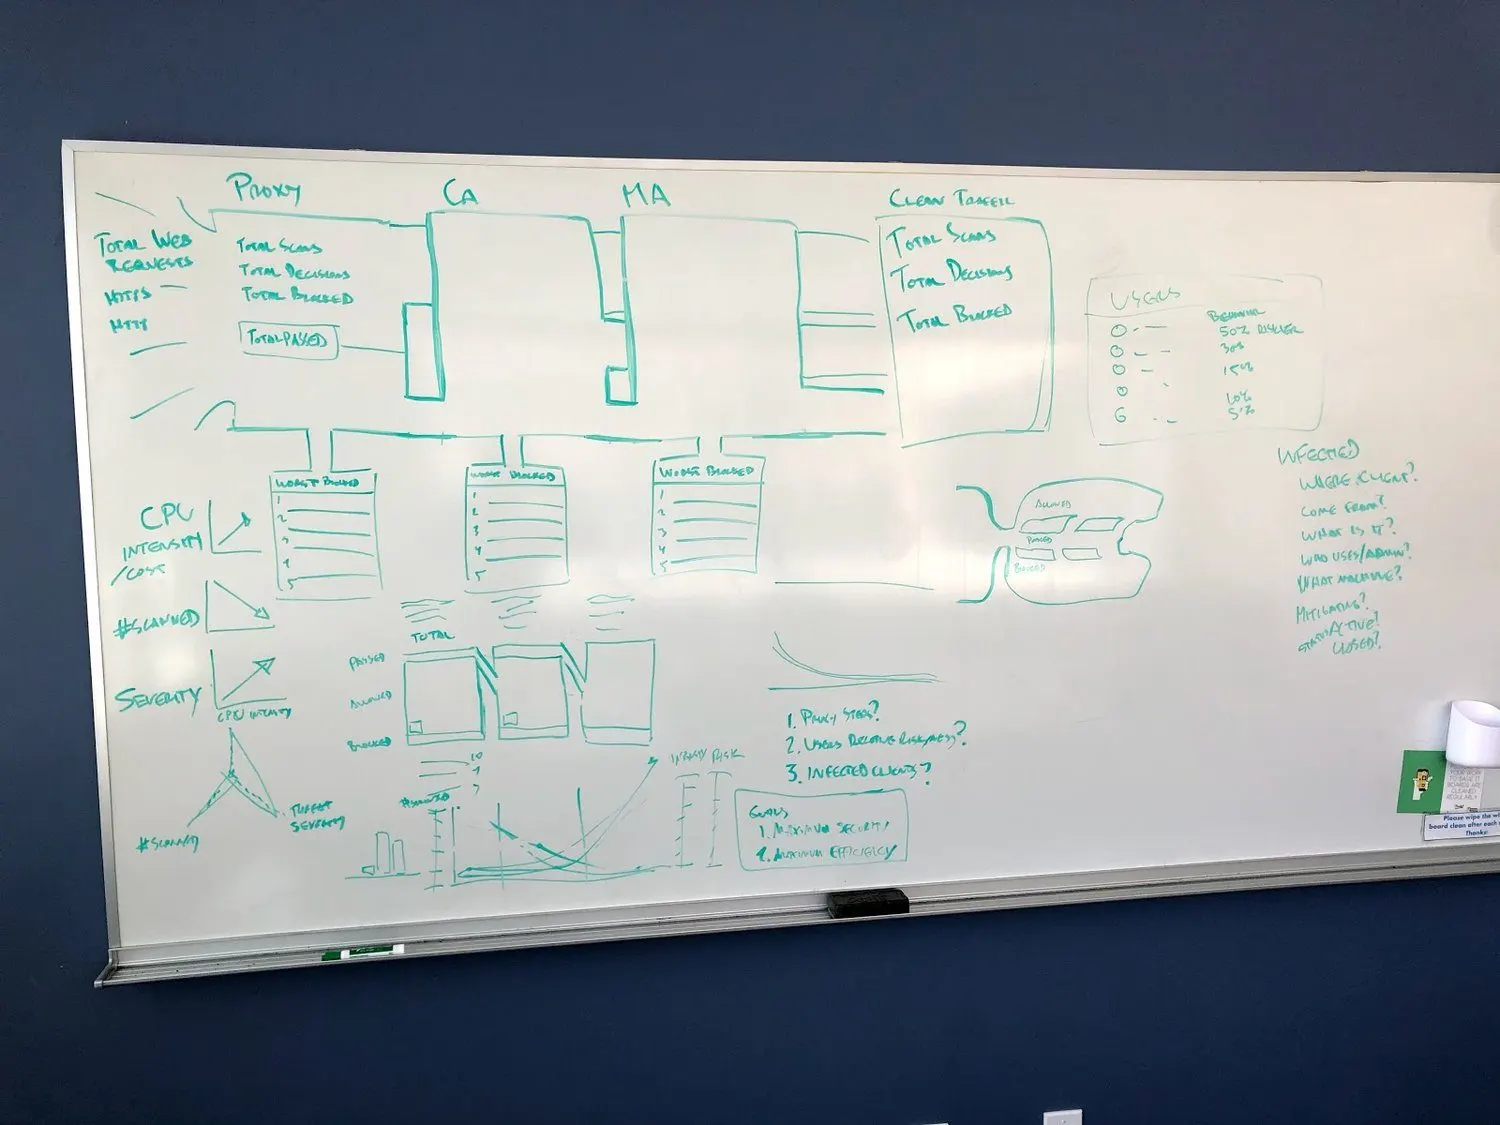
Ideas went up early, got blown up and got drawn again, with orange questions all over them.
Three days in one room, with an agenda built to end in decisions.
In January 2019 we ran a UX workshop with designers from other teams. Printouts on the table, stickies on the walls, and an agenda built to end with decisions.
One list on the board asked how to bring standards into real work: a preflight list for PMs, an epic template, and data table cells that devs start from the user story.
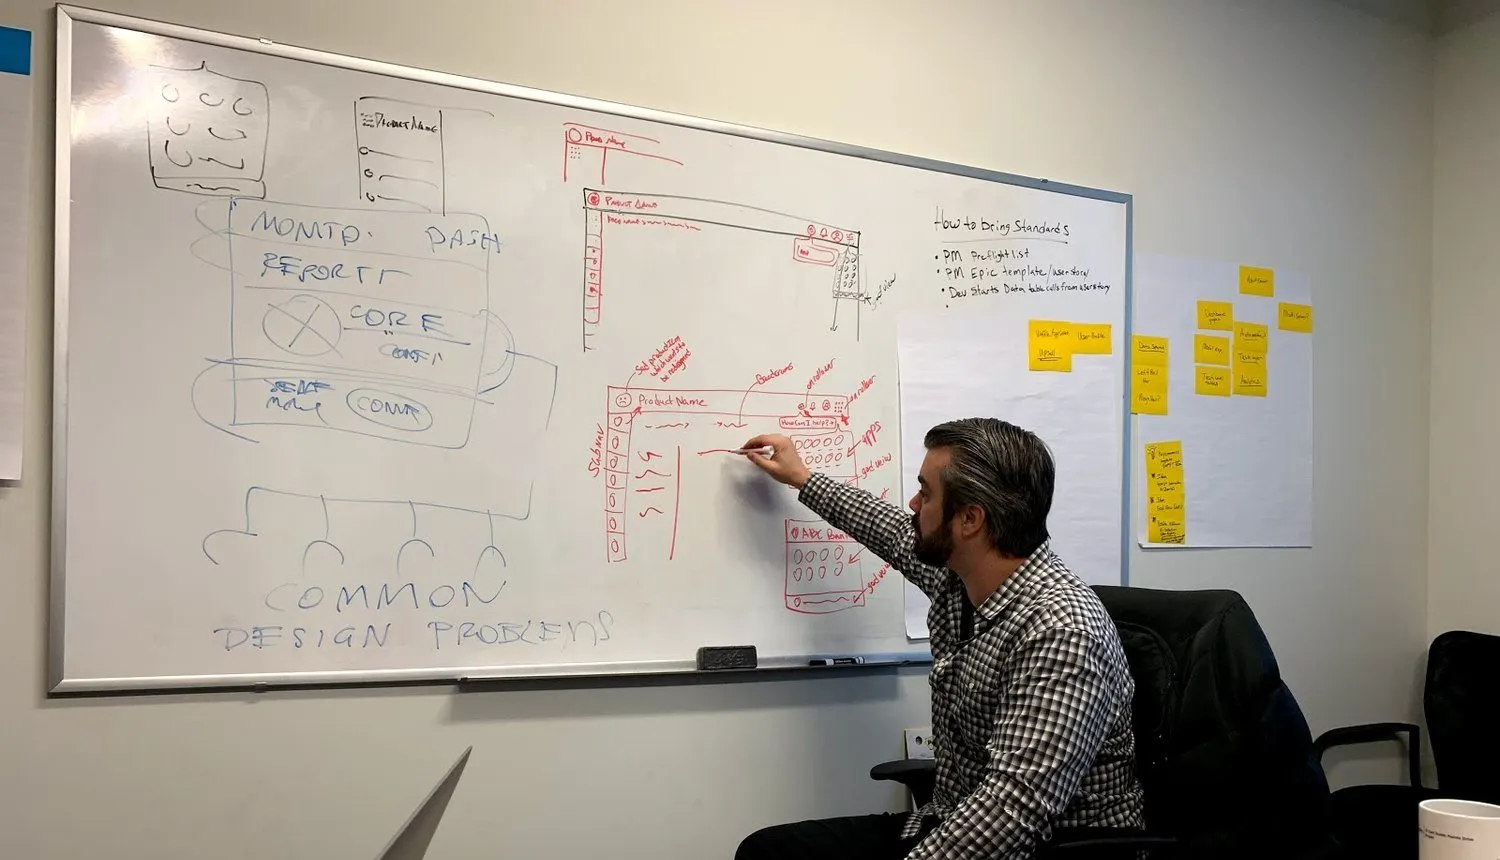
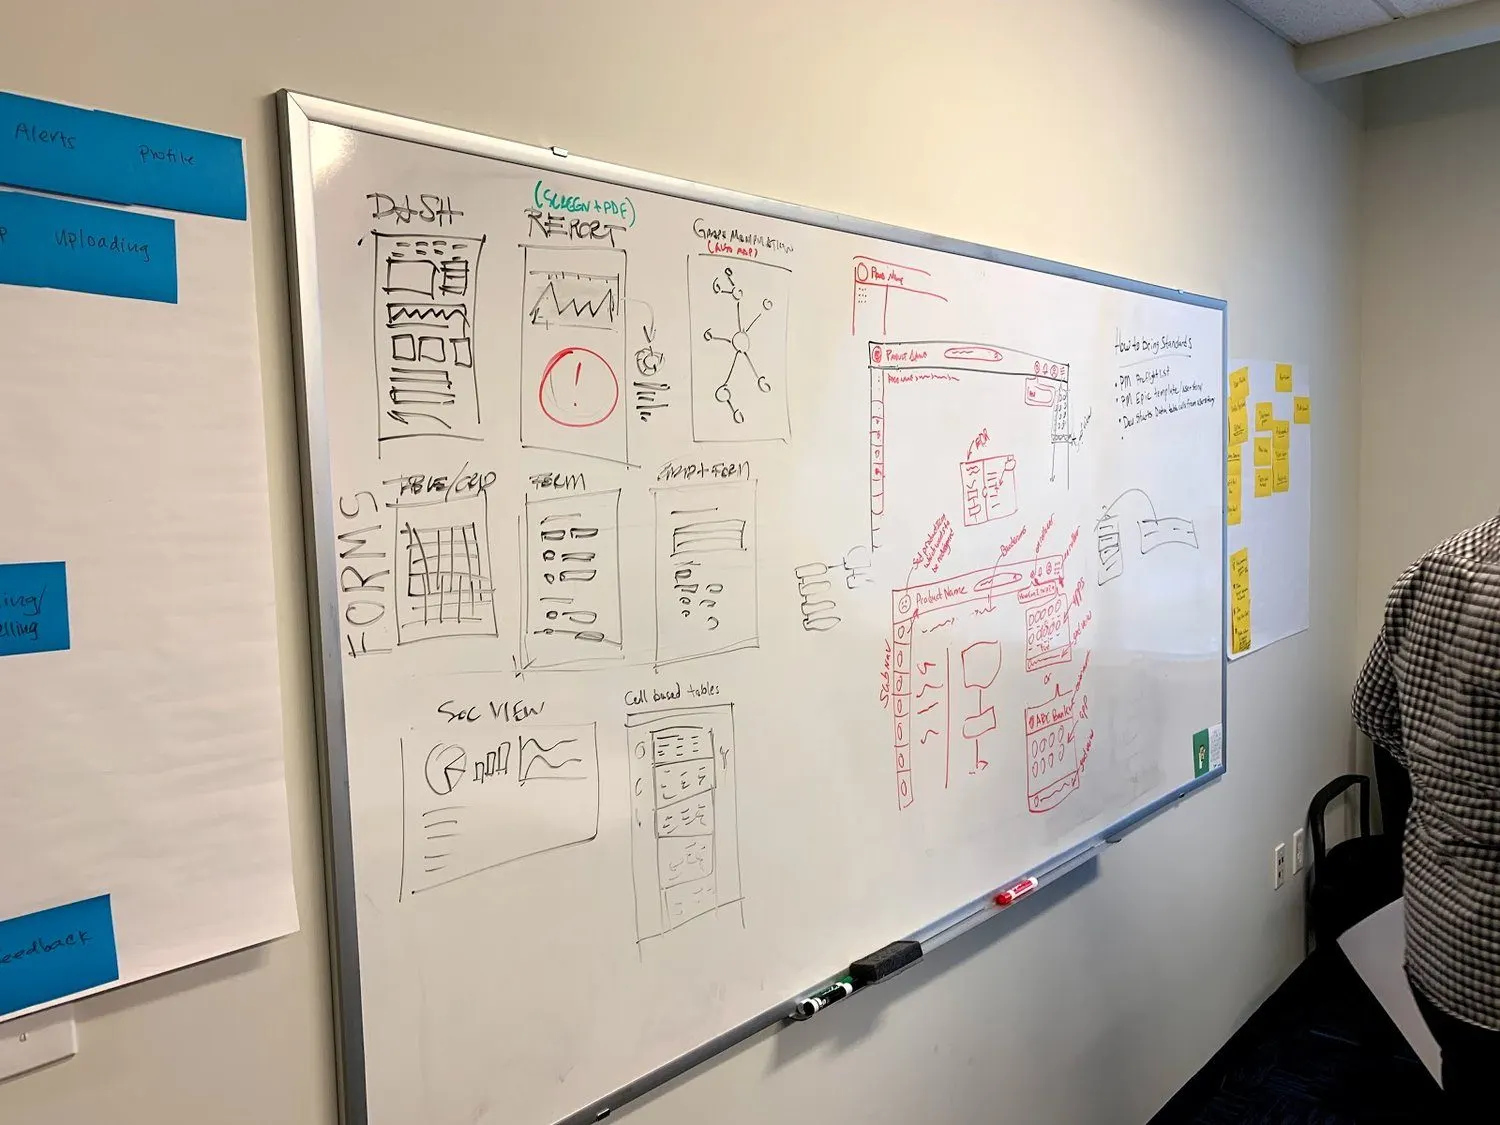
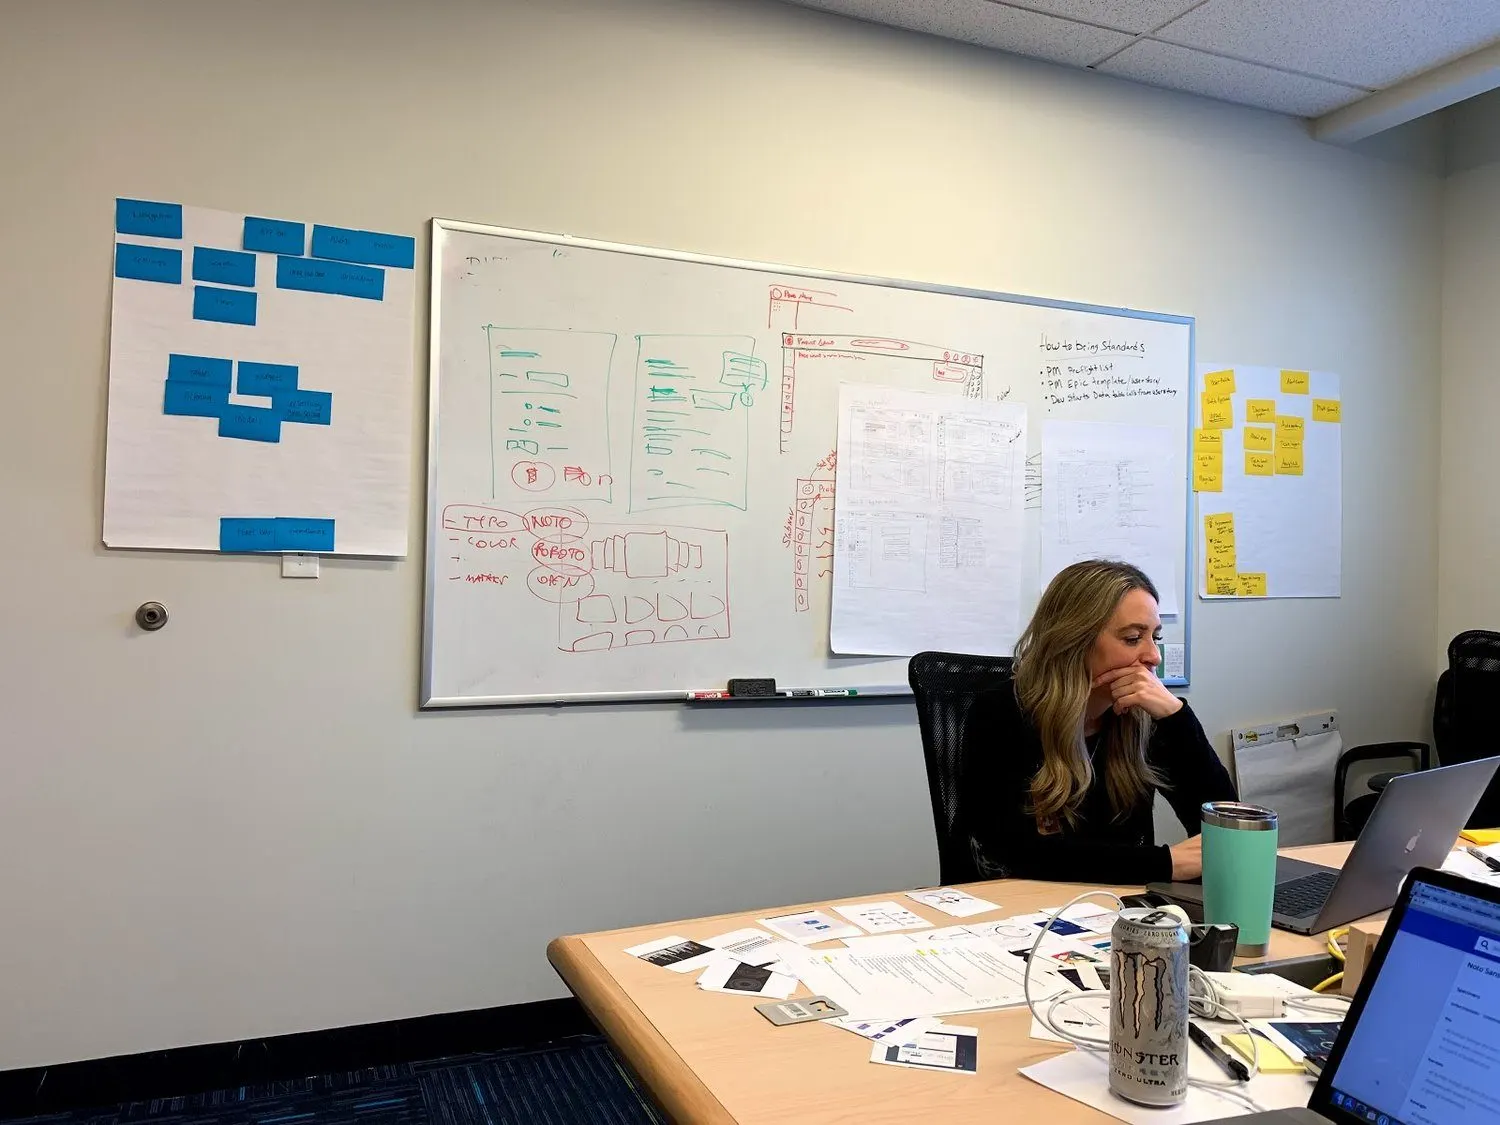
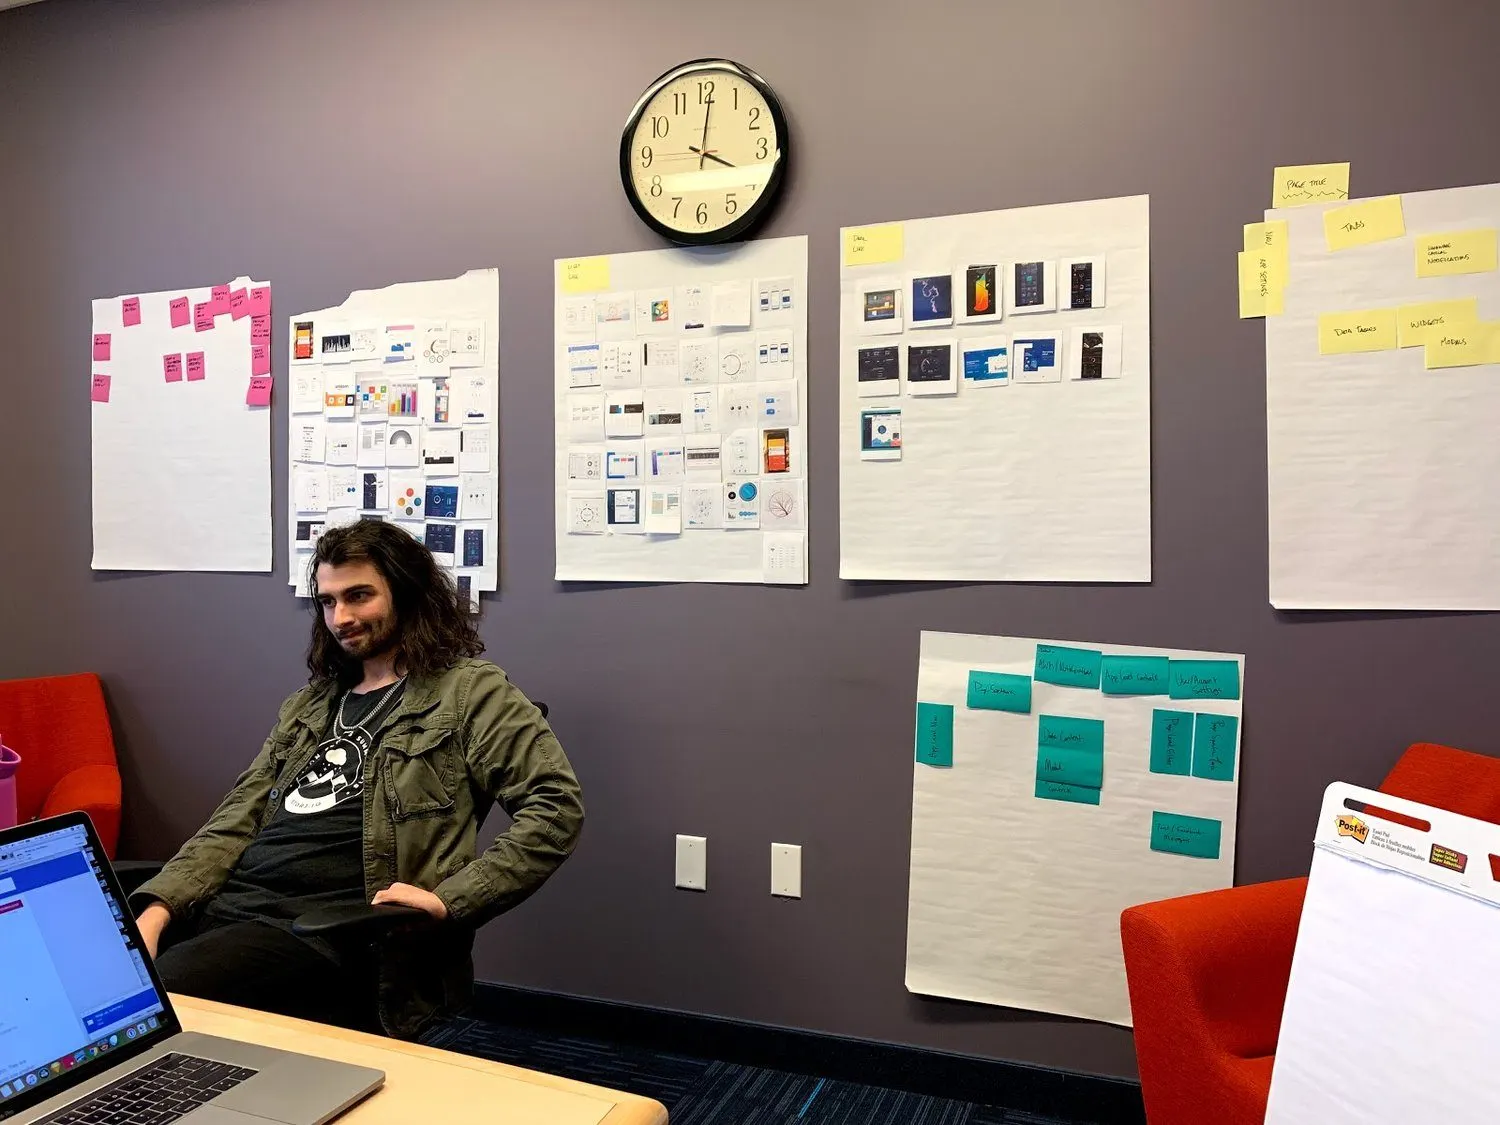
The January 2019 workshop: printouts, red pens and stickies, with designers from other teams.
- A template anyone could run
- We wrote down how to run a design session: the background, the current ideas, where you're stuck, at least 15 minutes of silent work, then review.
A rubric, so taste stopped being the argument.
Design reviews can turn into contests of opinion. The first goal of the workshop's second day was a shared measure that any new design could be judged against. We picked experience attributes together and talked through why.
Design spectra did the same for the look of things. Take one quality, like shape, from organic to rectilinear. Mark where we are today and where we want to be.
Then we turned the standard into four levels. Every product got a row in a tracking sheet, with a status for each item: enabled, on the roadmap, divergent or not needed. Each team added its next level to its own roadmap.
The four levels, from the easiest to adopt to the hardest. Each team added its next level to its own roadmap.
Uniting products from many acquisitions took countless meetings, and no mandate.
Symantec often grew through acquisition, so products arrived with their own styles. One acquisition alone brought more than 20 products. Earlier standards had stalled. By our count, about 250 to 300 designers across the company didn't know about each other, and they kept doing the same work twice.
Our 2018 vision deck made the case for one system: patterns as shared knowledge, so design time goes to big concepts. In 2019 we surveyed the product teams on framework, style and satisfaction, then walked through 20 products one at a time. One ran on MooTools. Another on Dojo. Another on Flex.
It took countless meetings and presentations with stakeholders. We won PM and VP buy-in for a phased plan, merged the efforts of the enterprise design groups, and moved toward common components, patterns and one look and feel.
Nobody was forced into it. Our own FAQ said product teams wouldn't be required to adopt it. It also said they might be shamed into it, with a smiley face.
- The case in five phrases
- Surprise and delight, data-driven design, a unified brand, speed to market and predictable navigation.
- A glimpse of the future
- Show where the products are, show the competition, then show what could be. Our plan ended on a demo.
- A place to keep talking
- Our plan for it: a shared Slack channel, sessions as new material came out, and one-on-ones with product and dev leads.
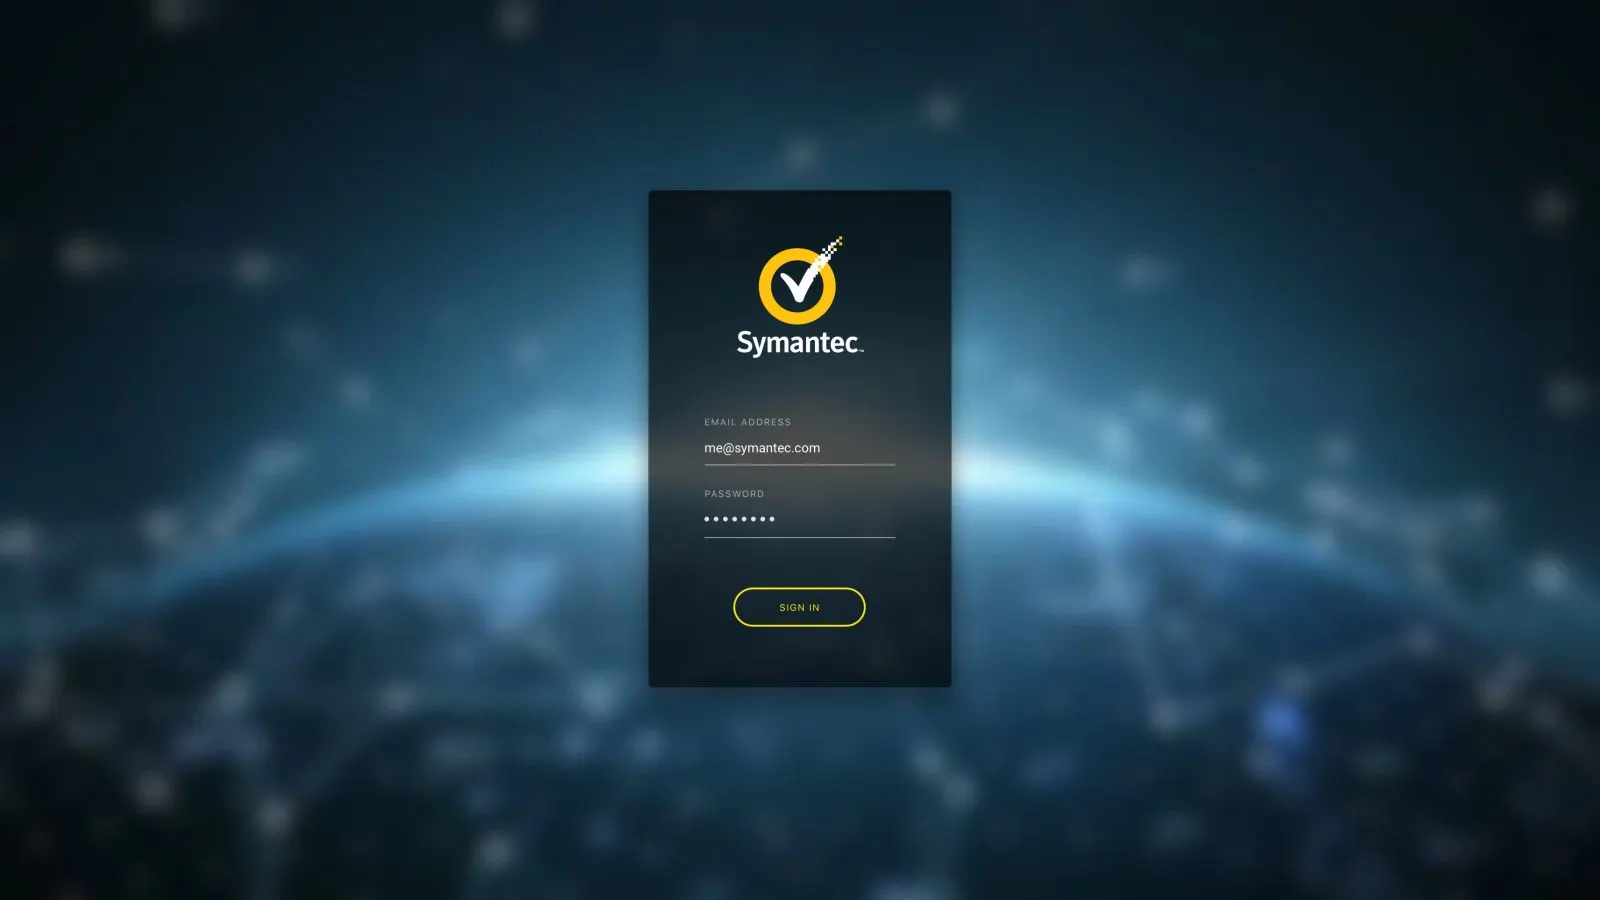
A still from our login screen demo.
I handed developers chart colors as math, ready to paste into code.
Thousands of charts were generated on the fly. They had to be accessible, and they had to look like one family at any size. A bunch of random colors wouldn't hold up.
I developed a process that stepped hue and brightness by how many colors a chart needed. Then I delivered the final HEX codes to developers as JSON arrays. They were pretty stoked about that.
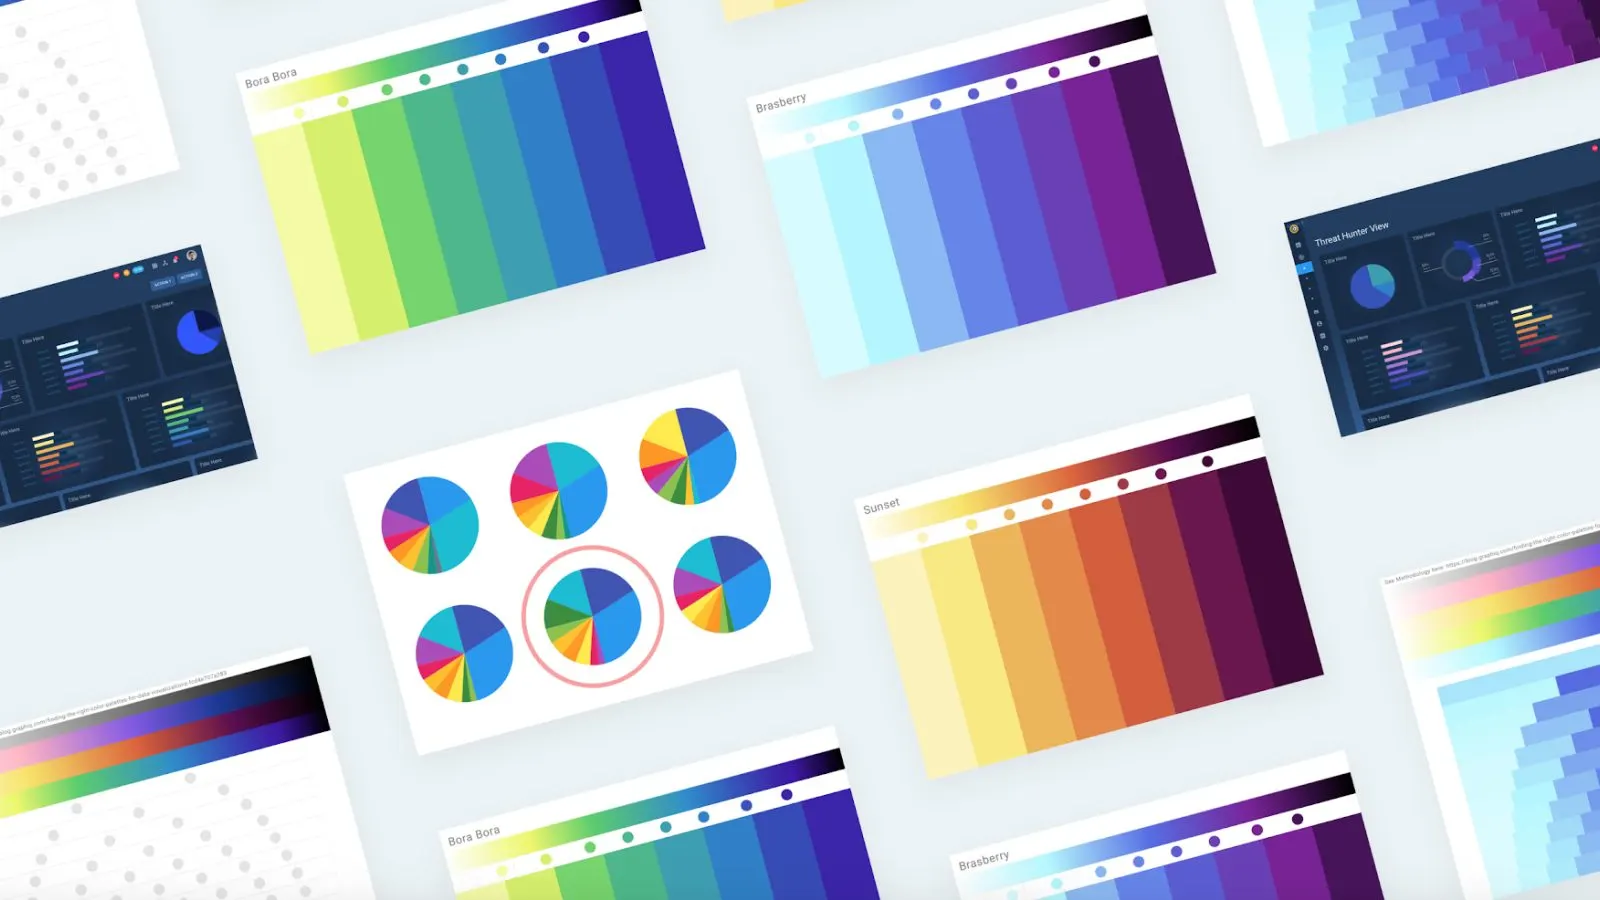
Color ramps built so thousands of generated charts look like one family at any size.
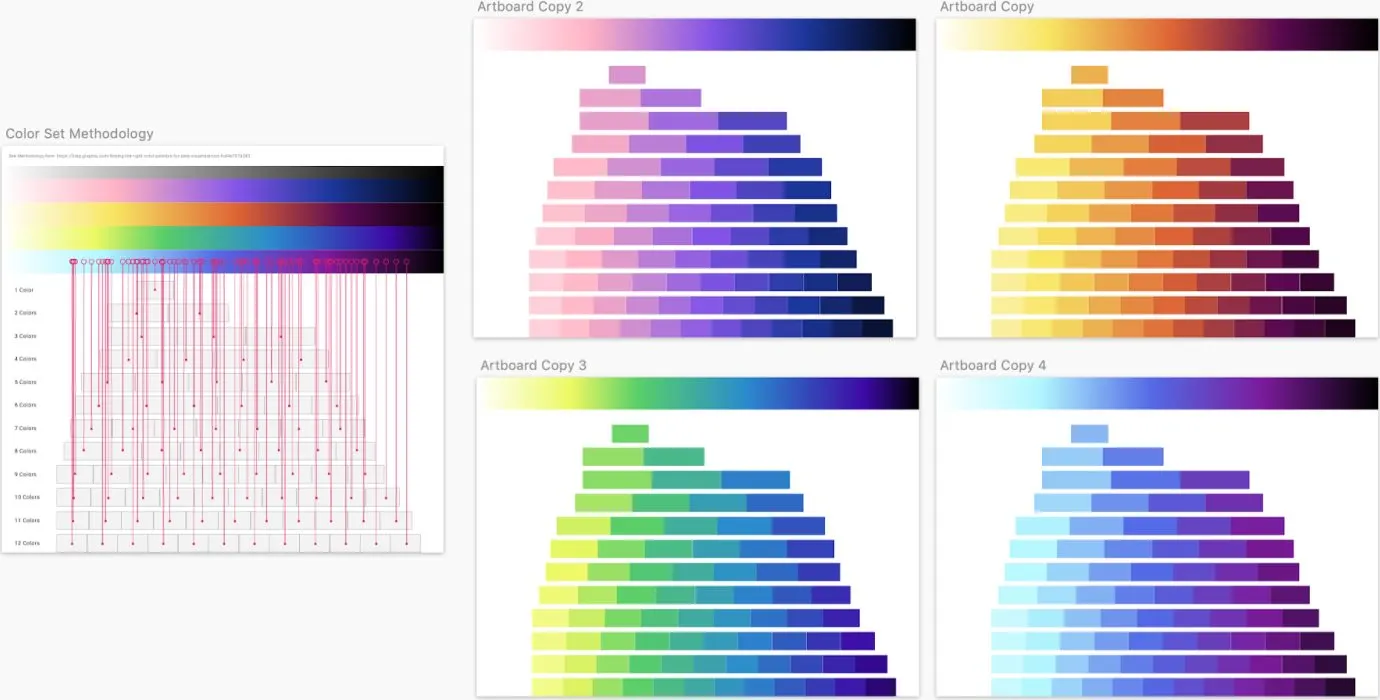
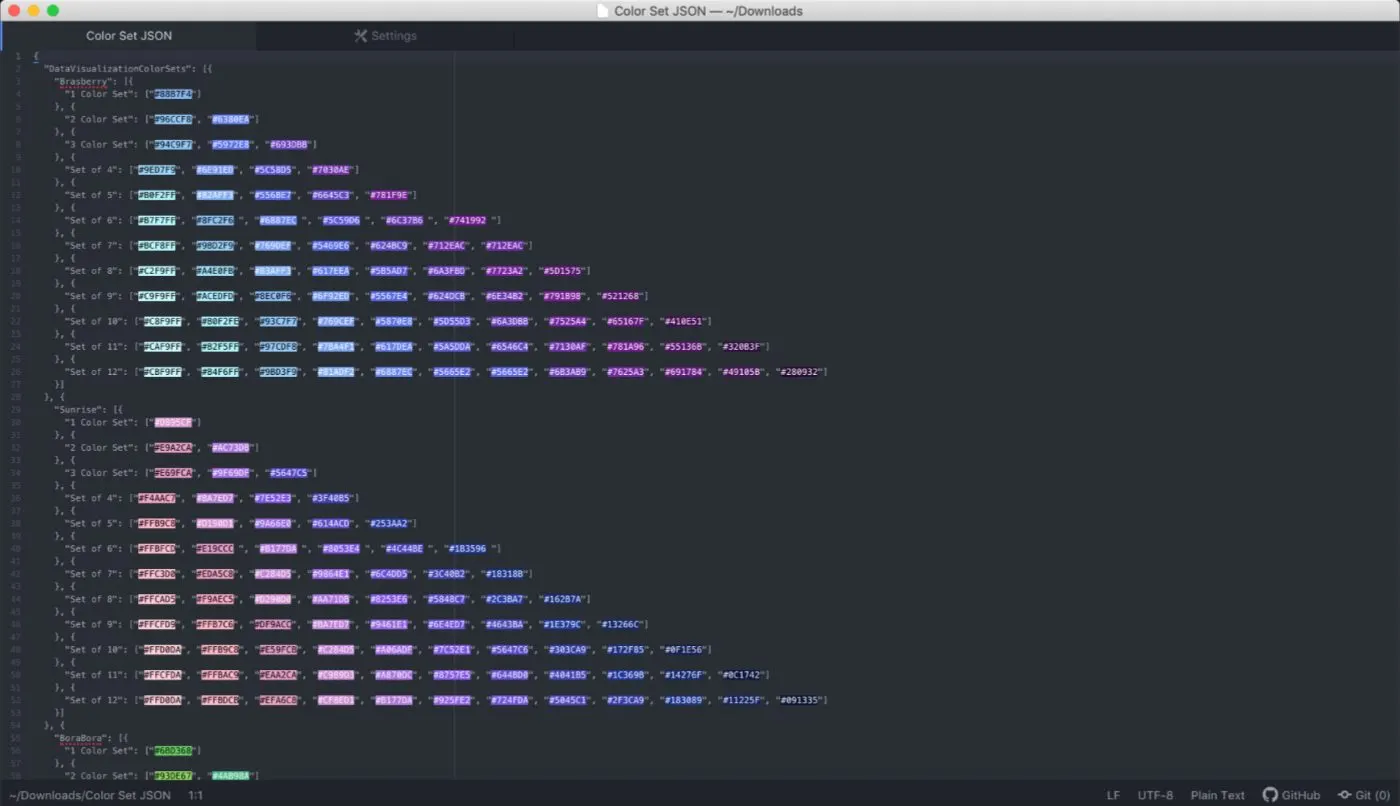
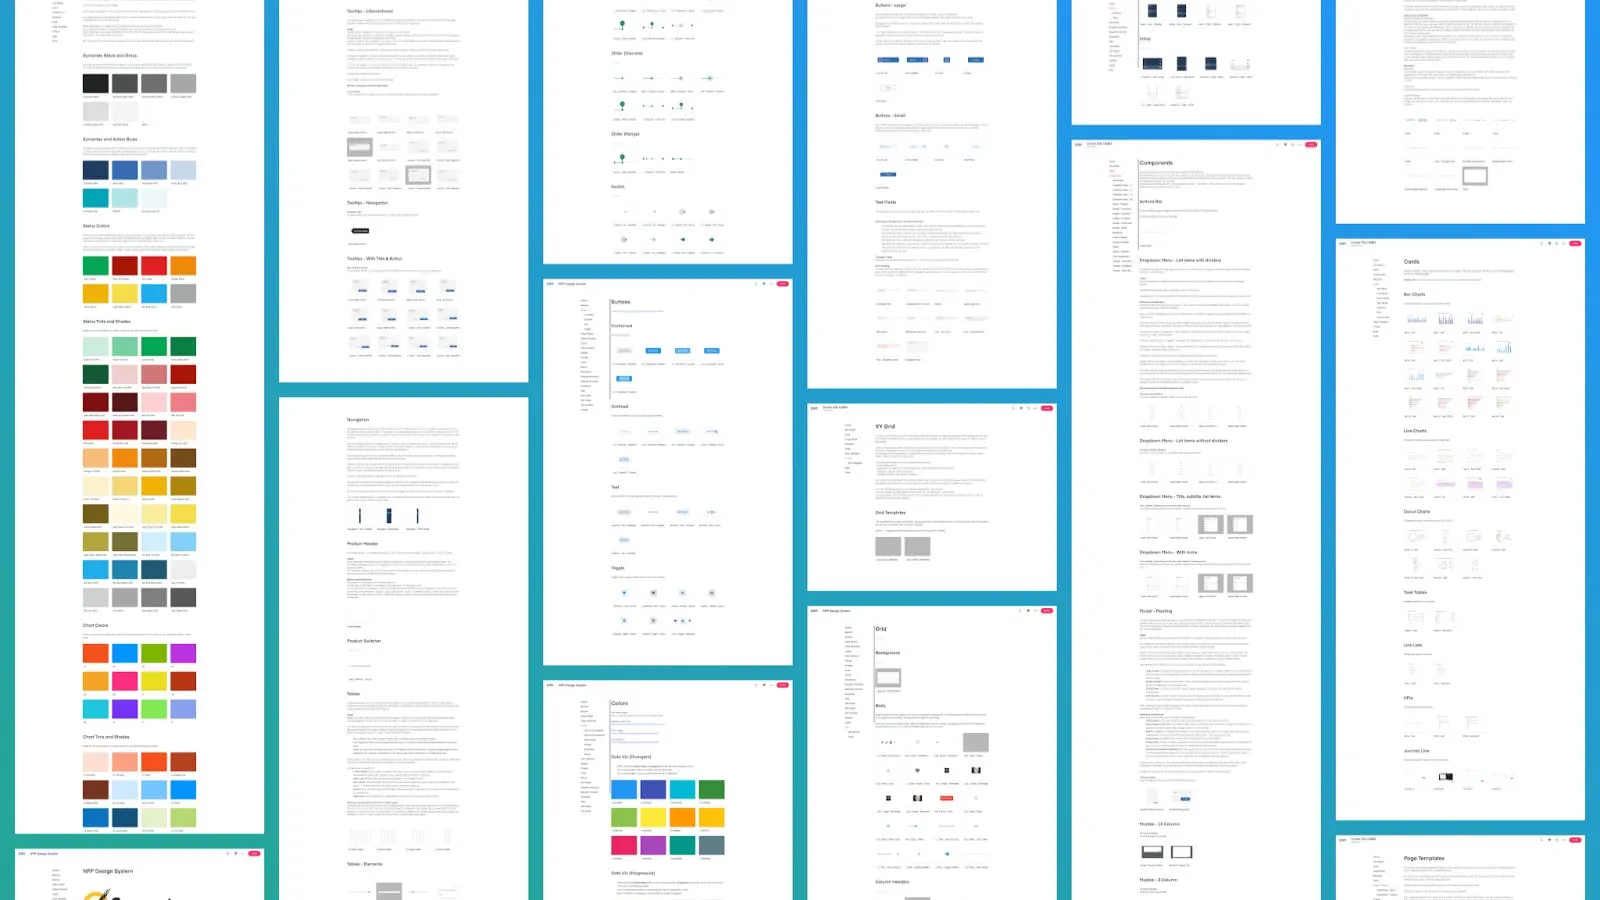
Hue and brightness stepped by how many colors a chart needs, delivered as JSON arrays of HEX codes, with the system docs around them.
- SketchScreens, flows, the color work
- InVisionPrototypes, Inspect for developers
- InVision DSMThe shared design library
- FigmaWeighed against InVision in the workshop
- Angular, Material, ClarityToolkits we compared the standard against
- Noto SansStandard type for the products
- JSONColor sets, ready for code
- SurveysAnalysts and product teams
- Site visitsCustomers and government agencies
- Whiteboards and stickiesWhere it all got decided
What I can't claim
- I can't name customers or agencies, or show what I saw at their sites.
- I don't have usage numbers to share for the dark theme, the navigation or Halo. The proof here is the problem, the work and the one support number.
- Earlier standards had stalled, and ours wasn't mandatory. In the last status sheet I have, many products were still on the roadmap.
- Halo can look overly complex. It made sense because our users were expert analysts who kept asking for more.
- That feature sat live for over four months before the customer who wanted it found it. We built that problem ourselves.
Got a powerful product people can't find their way around?
I'll go see how it really gets used, then help you fix it.
Start a conversation